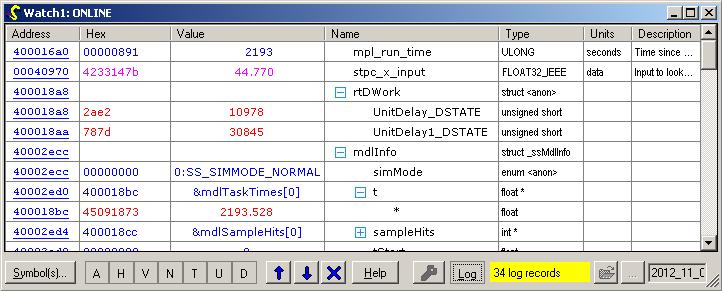
This shows how calibration parameters and RAM variables can be accessed and logged together in debugger-style watch windows. Parameters can be loaded from ASAP2 (.a2l) and linker (.elf) files simultaneously. Structures, pointers, bitfields and arrays can be explored:
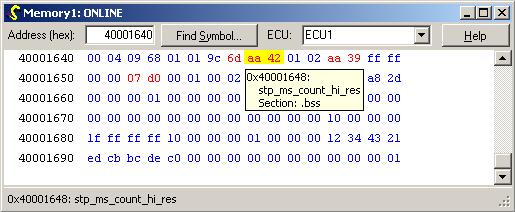
Debugger-style memory windows can be used to view and edit memory contents. Known symbols loaded from .a2l or .elf files are highlighted when the mouse pointer is placed over their locations:
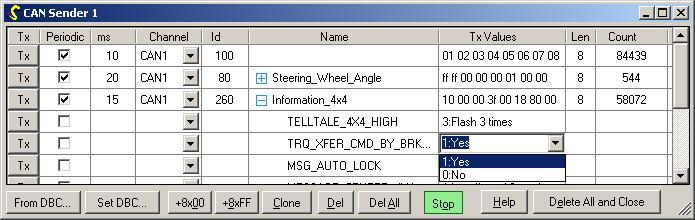
Further windows are integrated for CAN and diagnostic functions. For example, arbitrary CAN traffic can be generated by hand or using a .dbc file:
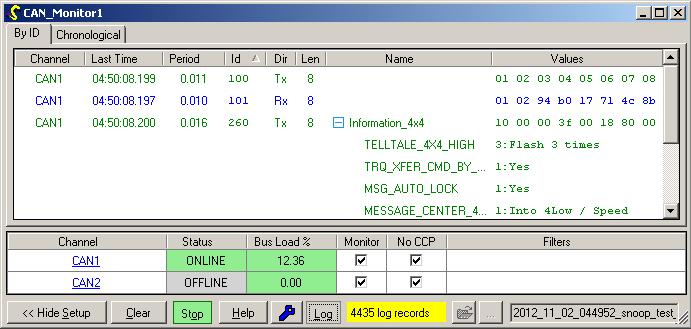
Similarly, CAN traffic can be monitored and logged: